Nendojo
A practice dojo for trading, on real market history.
Free · open source · runs in your browser
Practise trading on real candles.
Nendojo replays real market history one bar at a time. You decide, place a paper trade, and only then see what happened next. No money at risk, and no knowing the future.
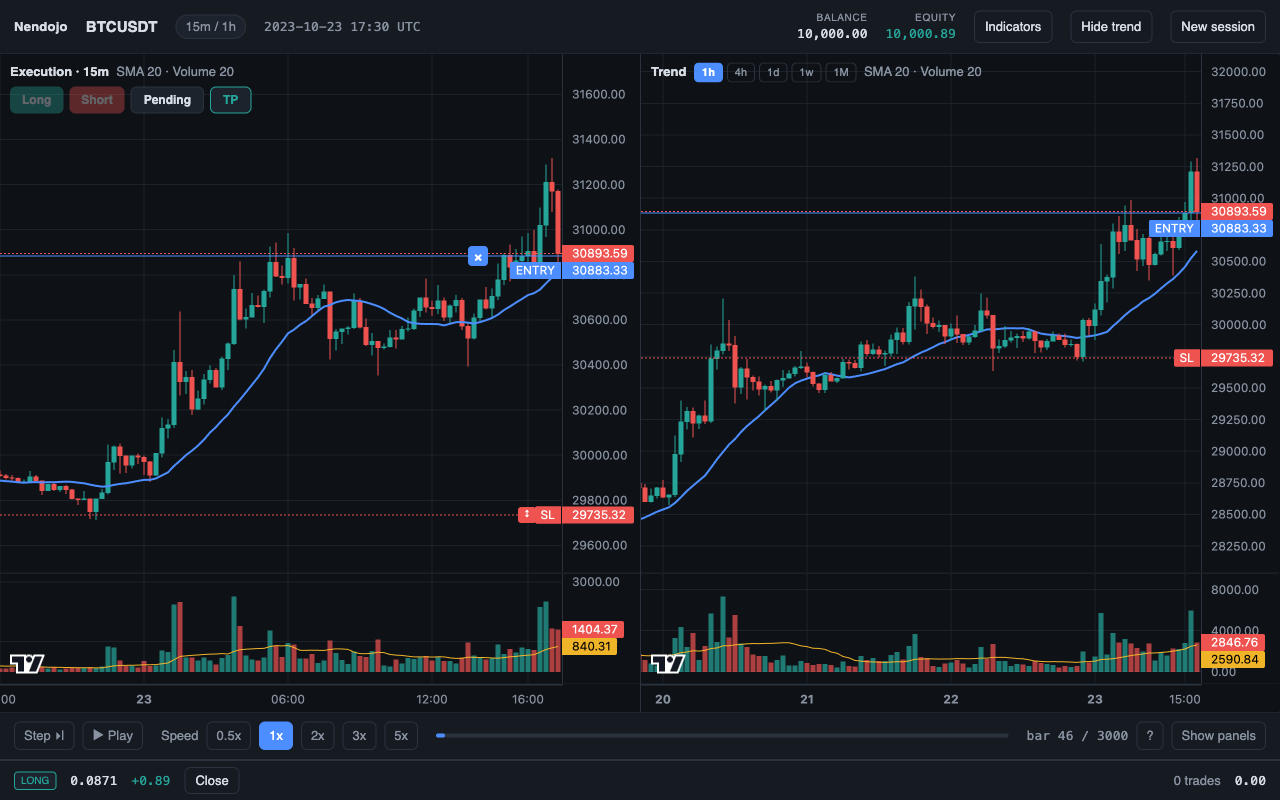
Fig. 1
└ The replay view
01 · Replay
What bar-by-bar replay is
A finished chart makes every trade look obvious, because you can see how it ended. Replay hides the right-hand side of the chart and releases one candle at a time, so you face the same uncertainty you face live. A month of practice fits into an evening, and every decision is recorded.
02 · Features
What you can do
Replay real history
Pick a pair, a timeframe and a date. Candles come from Binance's public data. Play, pause, or step one bar at a time, with a higher timeframe beside it.
Trade it on paper
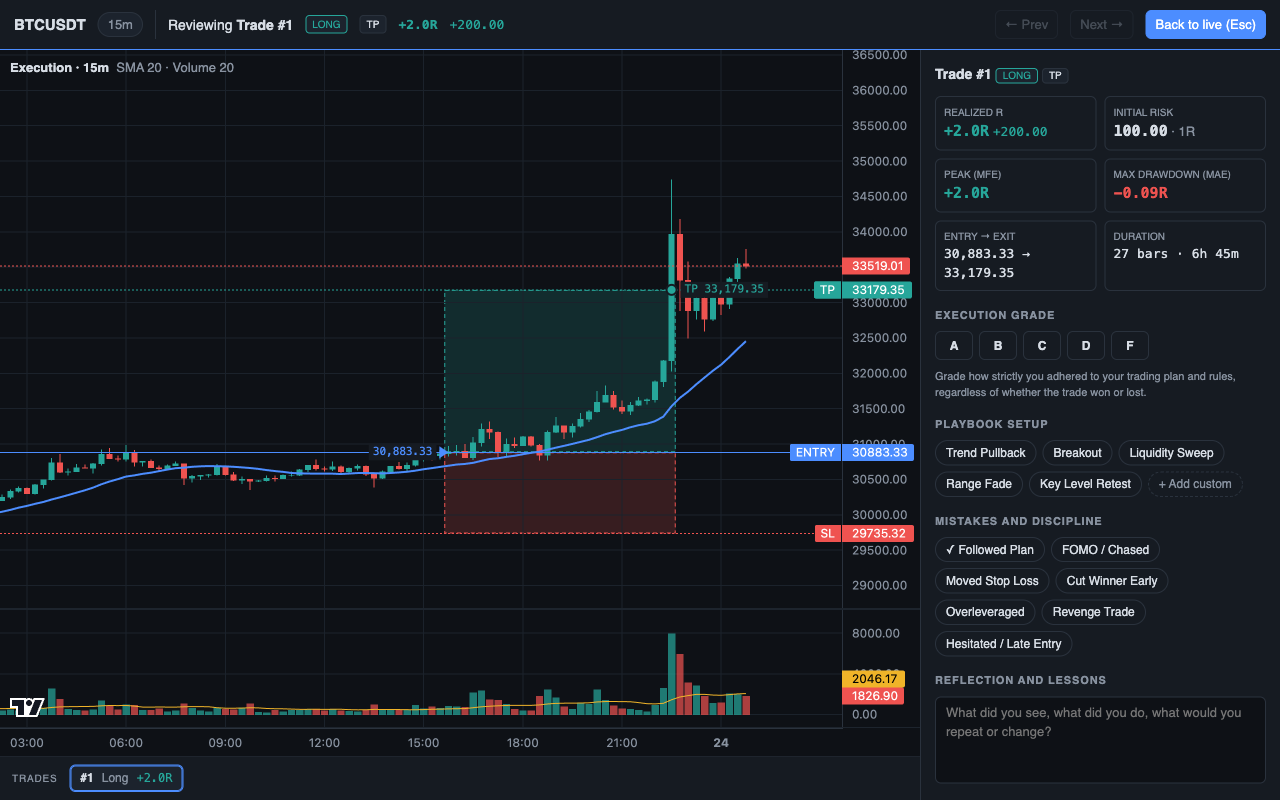
Market, limit and stop orders with a stop loss and a target. Position size follows the risk you set, as it should on a real account.
Review every trade in R
Each closed trade keeps its result in R, its best and worst moment, and your own grade, setup and notes. Export it all as CSV or JSON.
Use your own indicators
Built-in averages, RSI, MACD and more, or paste a Pine Script indicator. An indicator only ever sees the bars already released.
03 · Limits
Free, open and honest about its limits
- Free, with no account and no ads in the app.
- Open source under AGPL-3.0.
- Your sessions and trades stay in your browser. Nothing is uploaded.
- Fees and slippage are not simulated, so real results will be somewhat worse than paper results.
- Practice builds skill and discipline. It does not guarantee profit, and nothing here is financial advice.